Strategic
Asset Management
Performance figures
Strategic's returns are actual results of a model growth portfolio. The growth portfolio attempts to have equal to or less risk than the SP 500 large capitalization stock index over a multi year time period while outperforming the SP 500 index. For the purposes of comparison an investment in the ETF IVV was made. IVV is an etf index fund benchmarking the S&P 500 index and is used as the proxy for the S&P 500 index for this presentation. The performance measurement methodology of both the ETF IVV investment and the 'growth' portfolio are the same.
All trading fees (commission, custodial fees, etc) are included in the calculations. All capital gains and losses, both realized and unrealized are included in the calculations. All dividends, cash flows, returns of capital, etc are retained in the portfolio. Cash flows into the model portfolio are accounted for in the performance calculations.
Investing involves the risk of loss, especially in a growth portfolio attempting to mimic the total risk of the SP 500 large capitalization index.
The model growth portfolio primarily invests in publicly traded equity based securities but may also invest in mutual funds, bonds, etfs, preferred stocks, or other similar securities. Securities not available to the general public were never (nor will be) part of the model growth portfolio at any time.
Not all clients have a growth oriented portfolio and many clients have unique parameters causing their performance to differ. While Strategic attempts to have all 'growth' accounts mimic the model portfolio there can be no guarantee. Only one portfolio (the principal's 4 retirement accounts grouped together as one portfolio) was used in preparing these performance return numbers. Performance figures for all client's accounts are not used as the vast majority of client accounts have unique circumstances attached to them or are too small to include in a pure 'growth' model index and have differing time periods. (Not all clients have retained Strategic's services since Dec 31, 1999)
For the the model growth portfolio 1% was deducted from the actual return each year to reflect the average management fee Strategic levies on client portfolios.
| Yearly Returns | Cumulative | Annualized | |||||
| Sasm | SP 500 | Sasm | SP 500 | Sasm 5 year | SP500 5 year | Spread | |
| 1999 | 100.00 | 100 | |||||
| 2000 | 9.47% | -9.25% | 109.47 | 90.75 | |||
| 2001 | 3.89% | -11.51% | 113.73 | 80.30 | |||
| 2002 | -6.00% | -21.88% | 106.90 | 62.73 | |||
| 2003 | 32.10% | 27.99% | 141.22 | 80.29 | |||
| 2004 | 20.66% | 10.75% | 170.40 | 88.92 | 10.66% | -2.35% | 13.01% |
| 2005 | 14.45% | 4.88% | 195.02 | 93.26 | 11.55% | 0.55% | 11.00% |
| 2006 | 13.29% | 15.94% | 220.94 | 108.13 | 13.28% | 5.95% | 7.33% |
| 2007 | 9.49% | 4.74% | 241.90 | 113.26 | 16.33% | 11.81% | 4.52% |
| 2008 | -29.68% | -36.58% | 170.11 | 71.83 | 3.72% | -2.23% | 5.95% |
| 2009 | 18.46% | 26.62% | 201.51 | 90.95 | 3.35% | 0.45% | 2.90% |
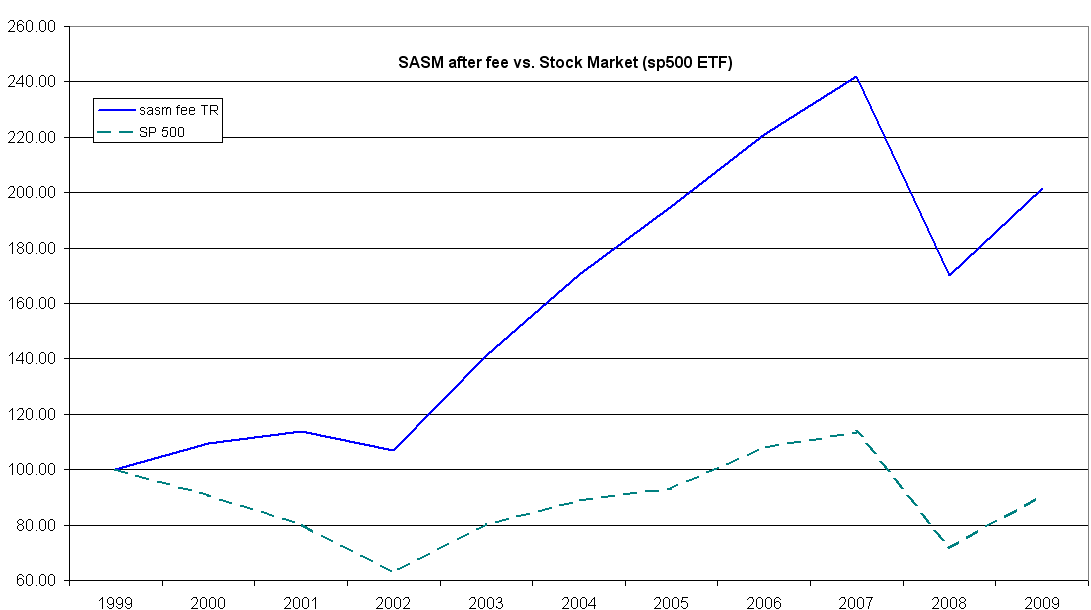
Chart below shows the model portfolios total return (with Strategic's average fee of 1% included) versus the SP 500 proxy 'IVV' over time.

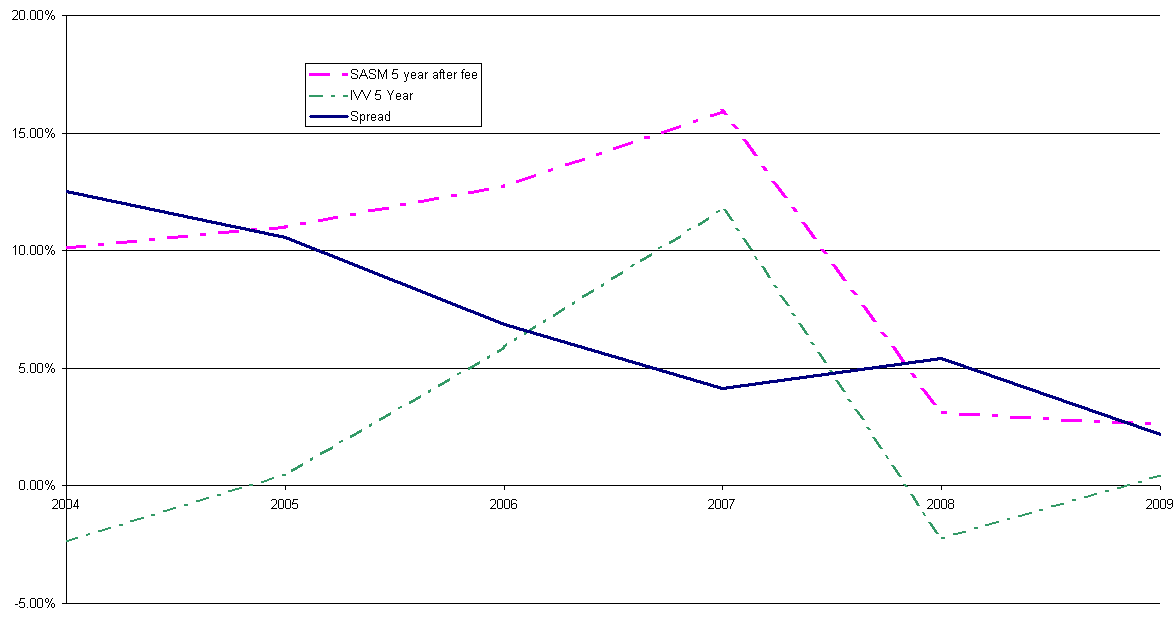
Here is a graph of 5 year rolling annualized returns of Strategic and the SP500 proxy etf 'IVV' and the difference between them. As you can see Strategic has consistently outperformed the SP500 over long time periods.

| Strategic Asset
Management voice: 253-927-0998 email: solutions@sasm.com Strategic Asset Management is an investment advisory firm registered in Washington State. |
For Email Marketing you can trust
|
|||||||||||||
